Introduction
Pancreatic ductal adenocarcinoma (PDAC) is the most common and aggressive form of pancreatic cancer and has a five-year survival rate below 15% (NCI, 2025). Signal Transducer and Activator of Transcription 3 (STAT3) is a cytoplasmic transcription factor that becomes activated through phosphorylation downstream of cytokine and growth factor signaling pathways, including IL-6/JAK signaling (Lesina et. al. 2011). Upon phosphorylation, STAT3 dimerizes and translocates to the nucleus, where it regulates the transcription of genes involved in cell proliferation, survival, inflammation, and immune response (Bromberg et. al. 2000). Constitutive activation of STAT3 has been observed in many cancers, including PDAC, where it contributes to tumor growth and resistance to cell death (Lesina et. al. 2011). In my lab, we have demonstrated successful degradation of STAT3 in the MDA-MB-231 breast cancer cell line using a novel strategy that directs STAT3 to the proteasome for targeted degradation. Given the aggressive nature of PDAC and the importance of STAT3 signaling in this disease, we are now investigating whether STAT3 can be similarly degraded in MiaPaCa-2 cells, an immortalized PDAC cell line, and whether its degradation reduces cell growth or survival. To support these experiments, I analyzed a recently published long-read RNA-seq dataset of pancreatic cancer cell lines (GEO: GSE293661; Luo et al., 2025) to define the baseline transcriptional landscape associated with STAT3 signaling. Because long-read RNA-seq improves transcript and isoform resolution, it is especially useful for identifying differences in STAT3 transcript composition that may not be captured by gene-level expression alone. Using curated gene sets representing STAT3-responsive transcriptional programs, I quantified pathway activity across samples, compared it with total STAT3 and STAT3 isoform abundance, and identified candidate transcriptional readouts associated with higher STAT3 pathway activity. Together, this analysis establishes a framework that can be applied after STAT3 degradation in MiaPaCa-2 cells to test whether loss of STAT3 is accompanied by reduced pathway output and changes in specific transcriptional markers. Gene set analyses were based on curated pathway collections, including MSigDB Hallmark gene sets and the HALLMARK_IL6_JAK_STAT3_SIGNALING signature.
Analysis pipeline
- Input dataset and metadata: Loaded the long-read RNA-seq isoform TPM matrix, GRCh38 reference gene annotation, collapsed isoform BED file, collapsed isoform FASTA file, and Hallmark gene-set file. Parsed the Hallmark GMT file into pathway-to-gene mappings for downstream pathway scoring.
- Annotation and data consolidation: Extracted Ensembl gene IDs from isoform identifiers, merged isoform-level expression rows with GRCh38 gene names, and integrated BED-derived feature annotations and FASTA-derived transcript sequences into a consolidated annotated isoform table.
- Isoform-level analysis: Retained the annotated isoform-level table as the master analysis object for transcript-specific analyses. Identified STAT3-associated isoforms, classified them as STAT3α, STAT3β, other annotated isoforms, or novel transcript models, and ranked STAT3 isoforms by mean expression across samples.
- Gene-level expression summaries: Generated temporary gene-level views by summing isoform-level expression values across transcript models assigned to the same gene symbol. Used these gene-level summaries for pathway scoring, gene-expression comparisons, and candidate-target analyses.
- Sample-level quality and similarity assessment: Recreated the published sample-wise transcript-expression correlation heatmap by calculating pairwise Pearson correlations between samples using transcript-level expression profiles in the published sample order.
- Pathway scoring: Calculated Hallmark pathway scores by selecting genes present in the expression matrix, z-scoring each gene across samples, and averaging z-scores within each pathway to obtain one pathway score per sample.
- STAT3-focused analyses: Quantified total STAT3 expression, STAT3α expression, and STAT3β expression across samples. Calculated relative STAT3 isoform composition per sample by summing expression within STAT3α, STAT3β, and all remaining STAT3-associated isoforms and converting each class to a percent of total STAT3 expression.
- STAT3 pathway comparisons: Compared total STAT3, STAT3α, and STAT3β expression with STAT3 pathway activity using scatterplots and Spearman correlation. For these analyses, STAT3 was excluded from the Hallmark IL6/JAK/STAT3 score to avoid circularity.
- Candidate target analysis: Evaluated selected downstream candidate genes by comparing gene-level expression with the STAT3 pathway score using Spearman correlation. For candidate-gene analyses, the full Hallmark IL6/JAK/STAT3 pathway score was used.
- Visualization and interpretation: Generated heatmaps, ranked isoform bar plots, stacked isoform-composition plots, multi-panel scatterplots, and summary correlation bar plots to compare transcript structure, pathway activity, and candidate-gene associations across the PDAC sample set.
Key results
Figure 1
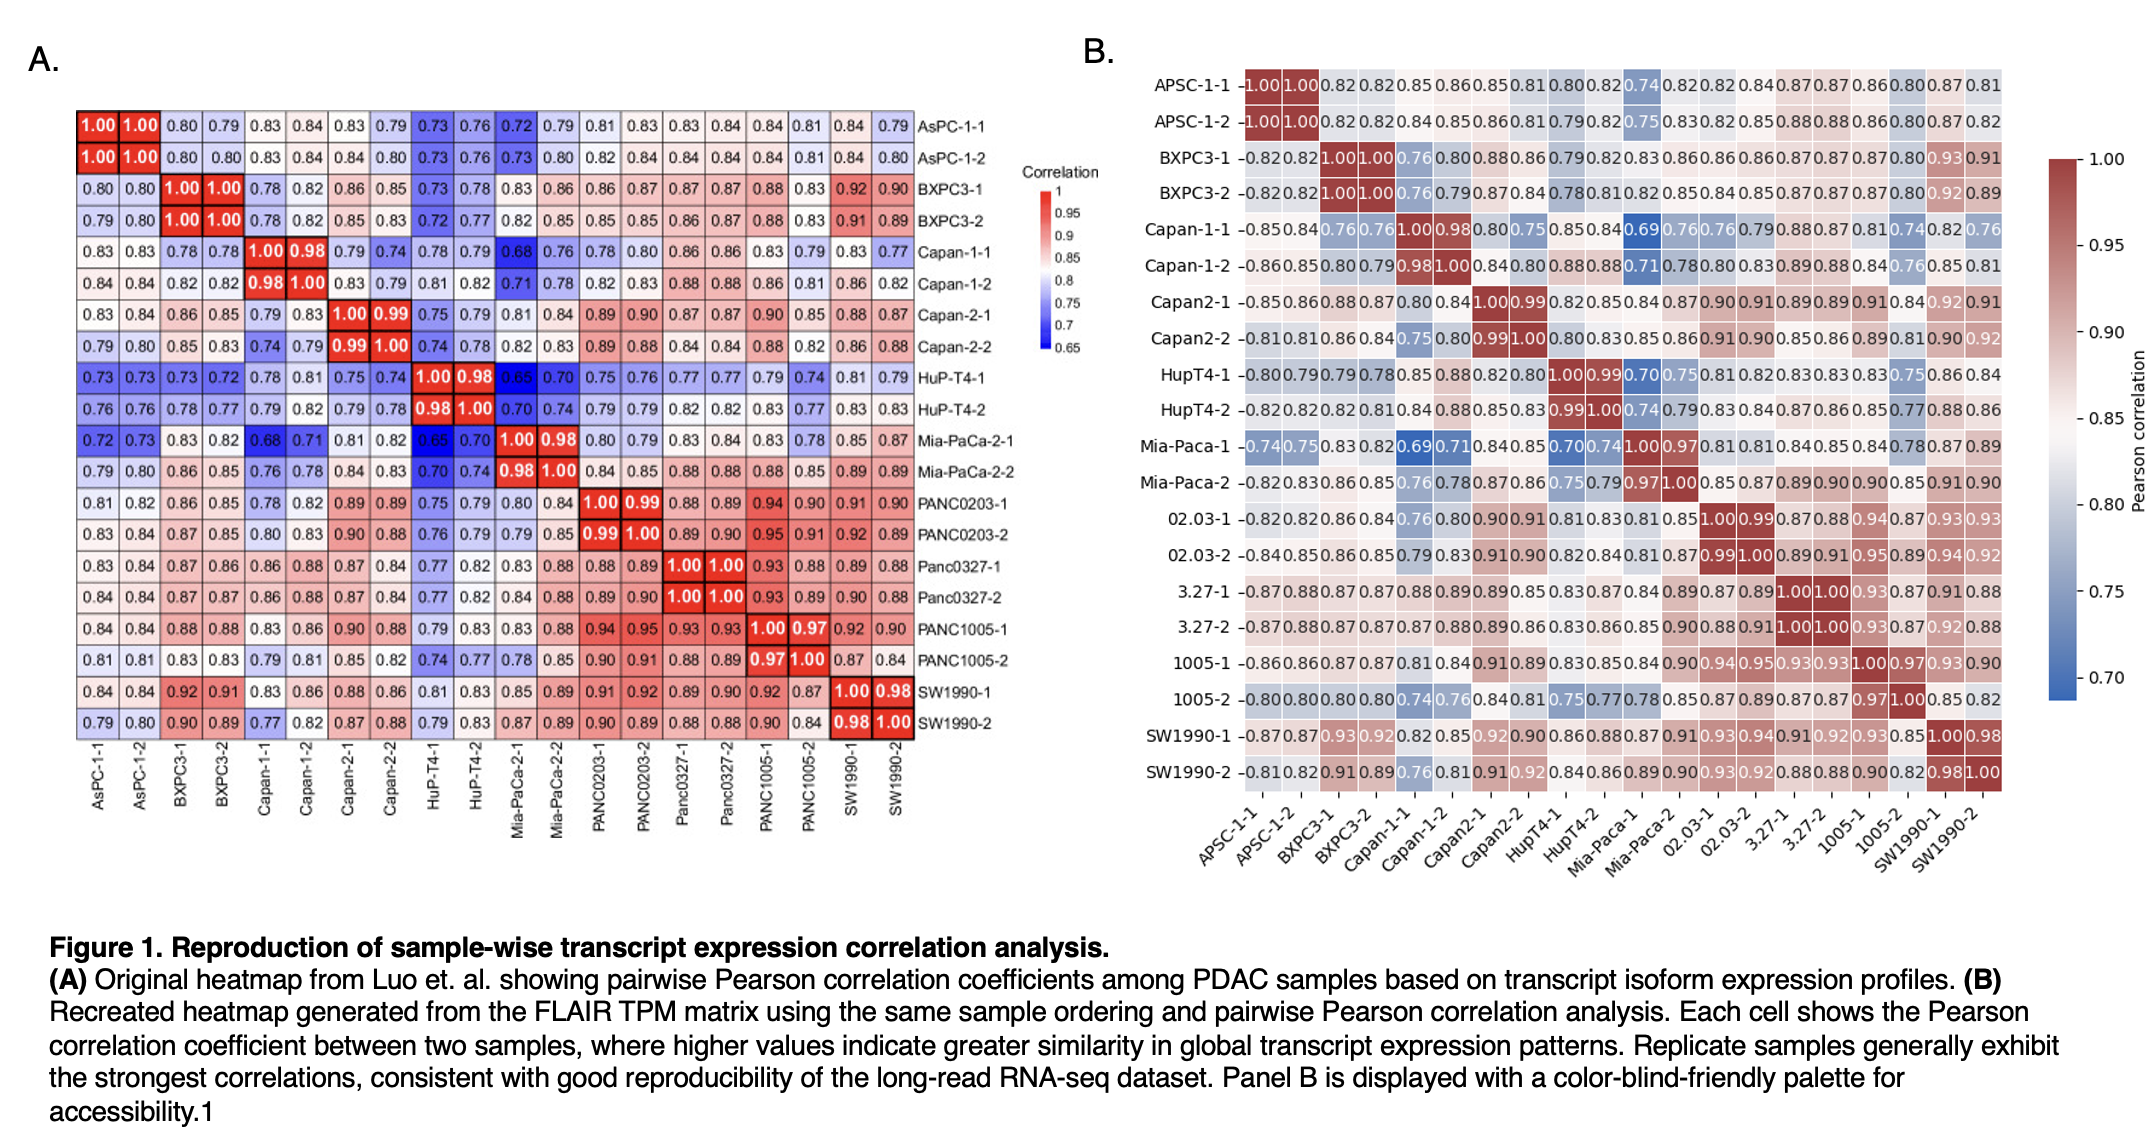
To determine whether our reanalysis recovered the transcript-level structure reported in the original study, we compared the published sample-wise Pearson correlation heatmap with a heatmap generated from the FLAIR TPM matrix using the same sample order and correlation analysis. The reproduced heatmap preserved the main features of the original, including strong correlations between biological replicates and similar relationships across PDAC samples. These results indicate that the reprocessing pipeline captures the global isoform expression patterns of the dataset with good fidelity.
Figure 2
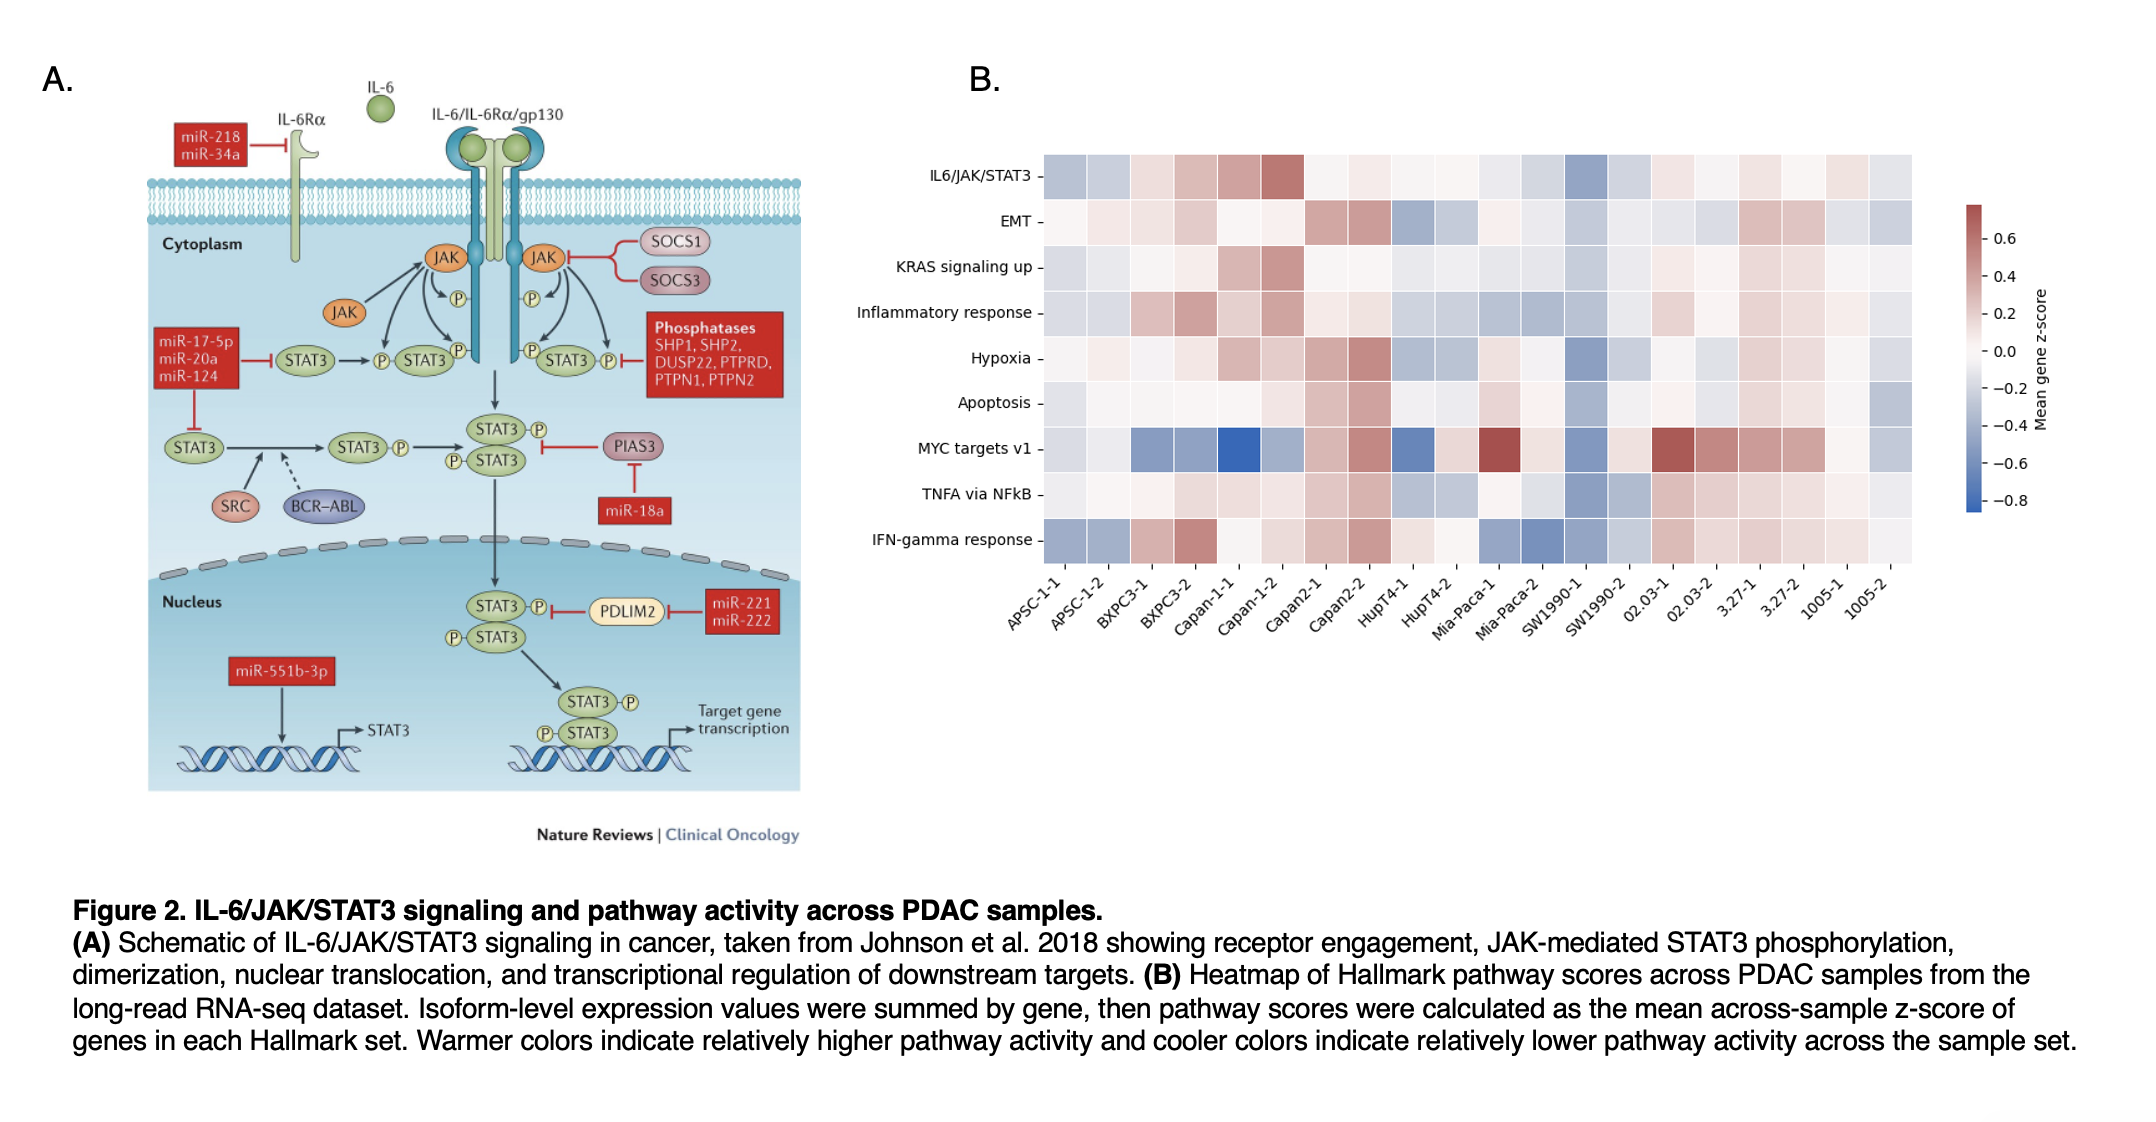
To place the transcriptomic analysis in a biological context relevant to PDAC, we examined IL-6/JAK/STAT3 signaling alongside related Hallmark pathway activity across samples. The schematic in panel A outlines the major components of STAT3 activation and transcriptional output, while panel B shows that pathway activity varies across models rather than remaining uniform across the dataset. Samples with higher IL-6/JAK/STAT3 activity also tended to show differences in pathways linked to inflammation, hypoxia, EMT, and MYC-associated programs, consistent with heterogeneity in oncogenic signaling states across PDAC models.
Figure 3
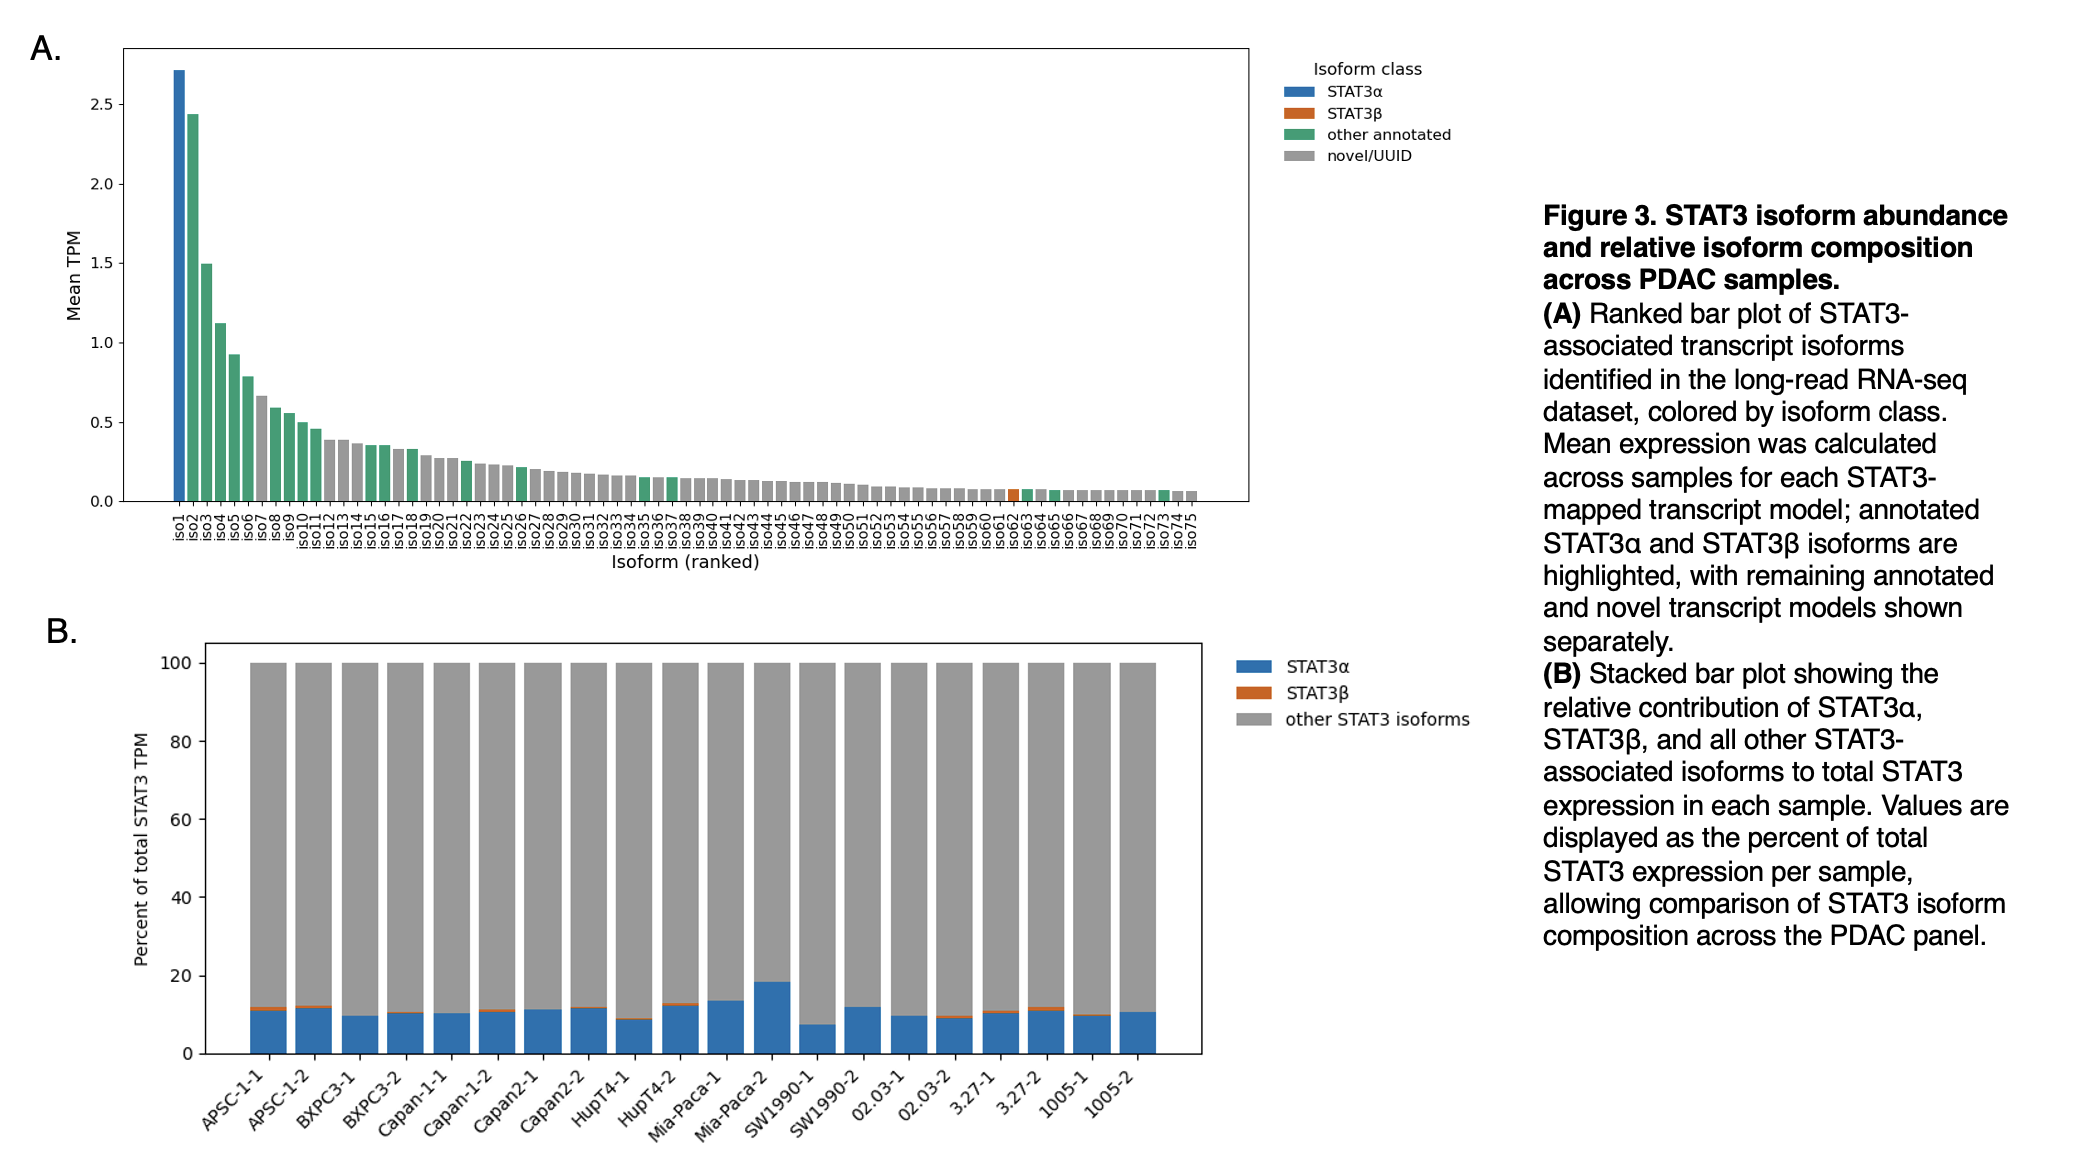
To define the isoform composition of STAT3 across the PDAC panel, we quantified the abundance of all STAT3-associated transcript models and compared their relative contributions within each sample. Although a small number of isoforms accounted for most STAT3 expression, the canonical STAT3α isoform represented only a minor fraction of the total, while STAT3β was consistently rare. Instead, most STAT3 signal was derived from other annotated or novel transcript models, and this overall composition was broadly similar across samples, with modest variation in the proportion of STAT3α. These results indicate that STAT3 expression in this dataset is dominated by noncanonical isoforms rather than the classically emphasized α and β forms.
Figure 4
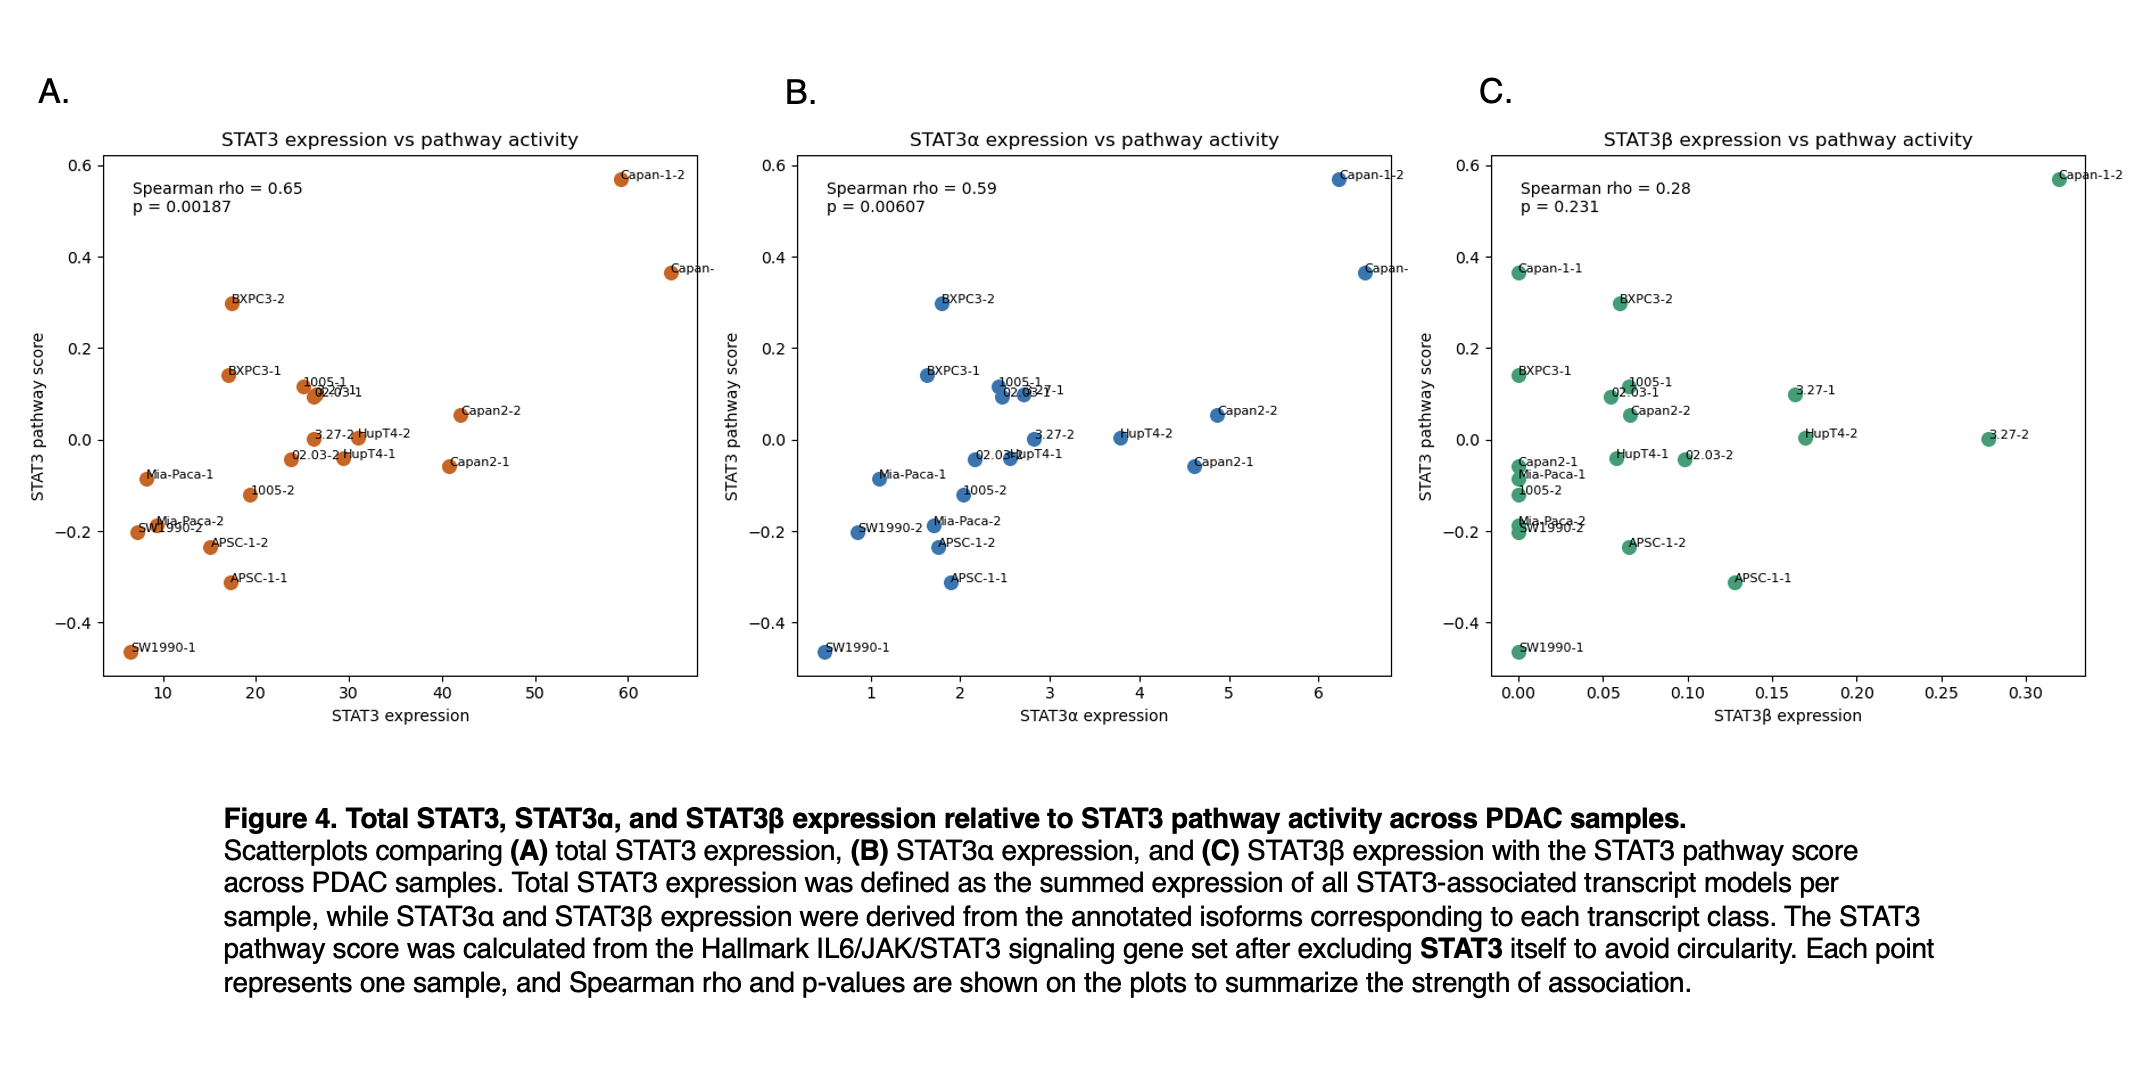
To test whether STAT3 transcript abundance tracked with inferred pathway output across the PDAC panel, we compared total STAT3, STAT3α, and STAT3β expression with the STAT3 pathway score. Total STAT3 expression showed a moderately strong positive association with pathway activity (Spearman ρ = 0.65, p = 0.00187), and STAT3α expression showed a similar but slightly weaker correlation (Spearman ρ = 0.59, p = 0.00607), indicating that higher expression of either measure tends to accompany higher STAT3 pathway activity across samples. In contrast, STAT3β expression was only weakly associated with pathway score and did not reach statistical significance (Spearman ρ = 0.28, p = 0.231). Together, these results support a robust monotonic relationship between pathway activity and both total STAT3 and STAT3α expression, but provide little evidence that STAT3β abundance explains variation in STAT3 signaling in this cohort.
Figure 5
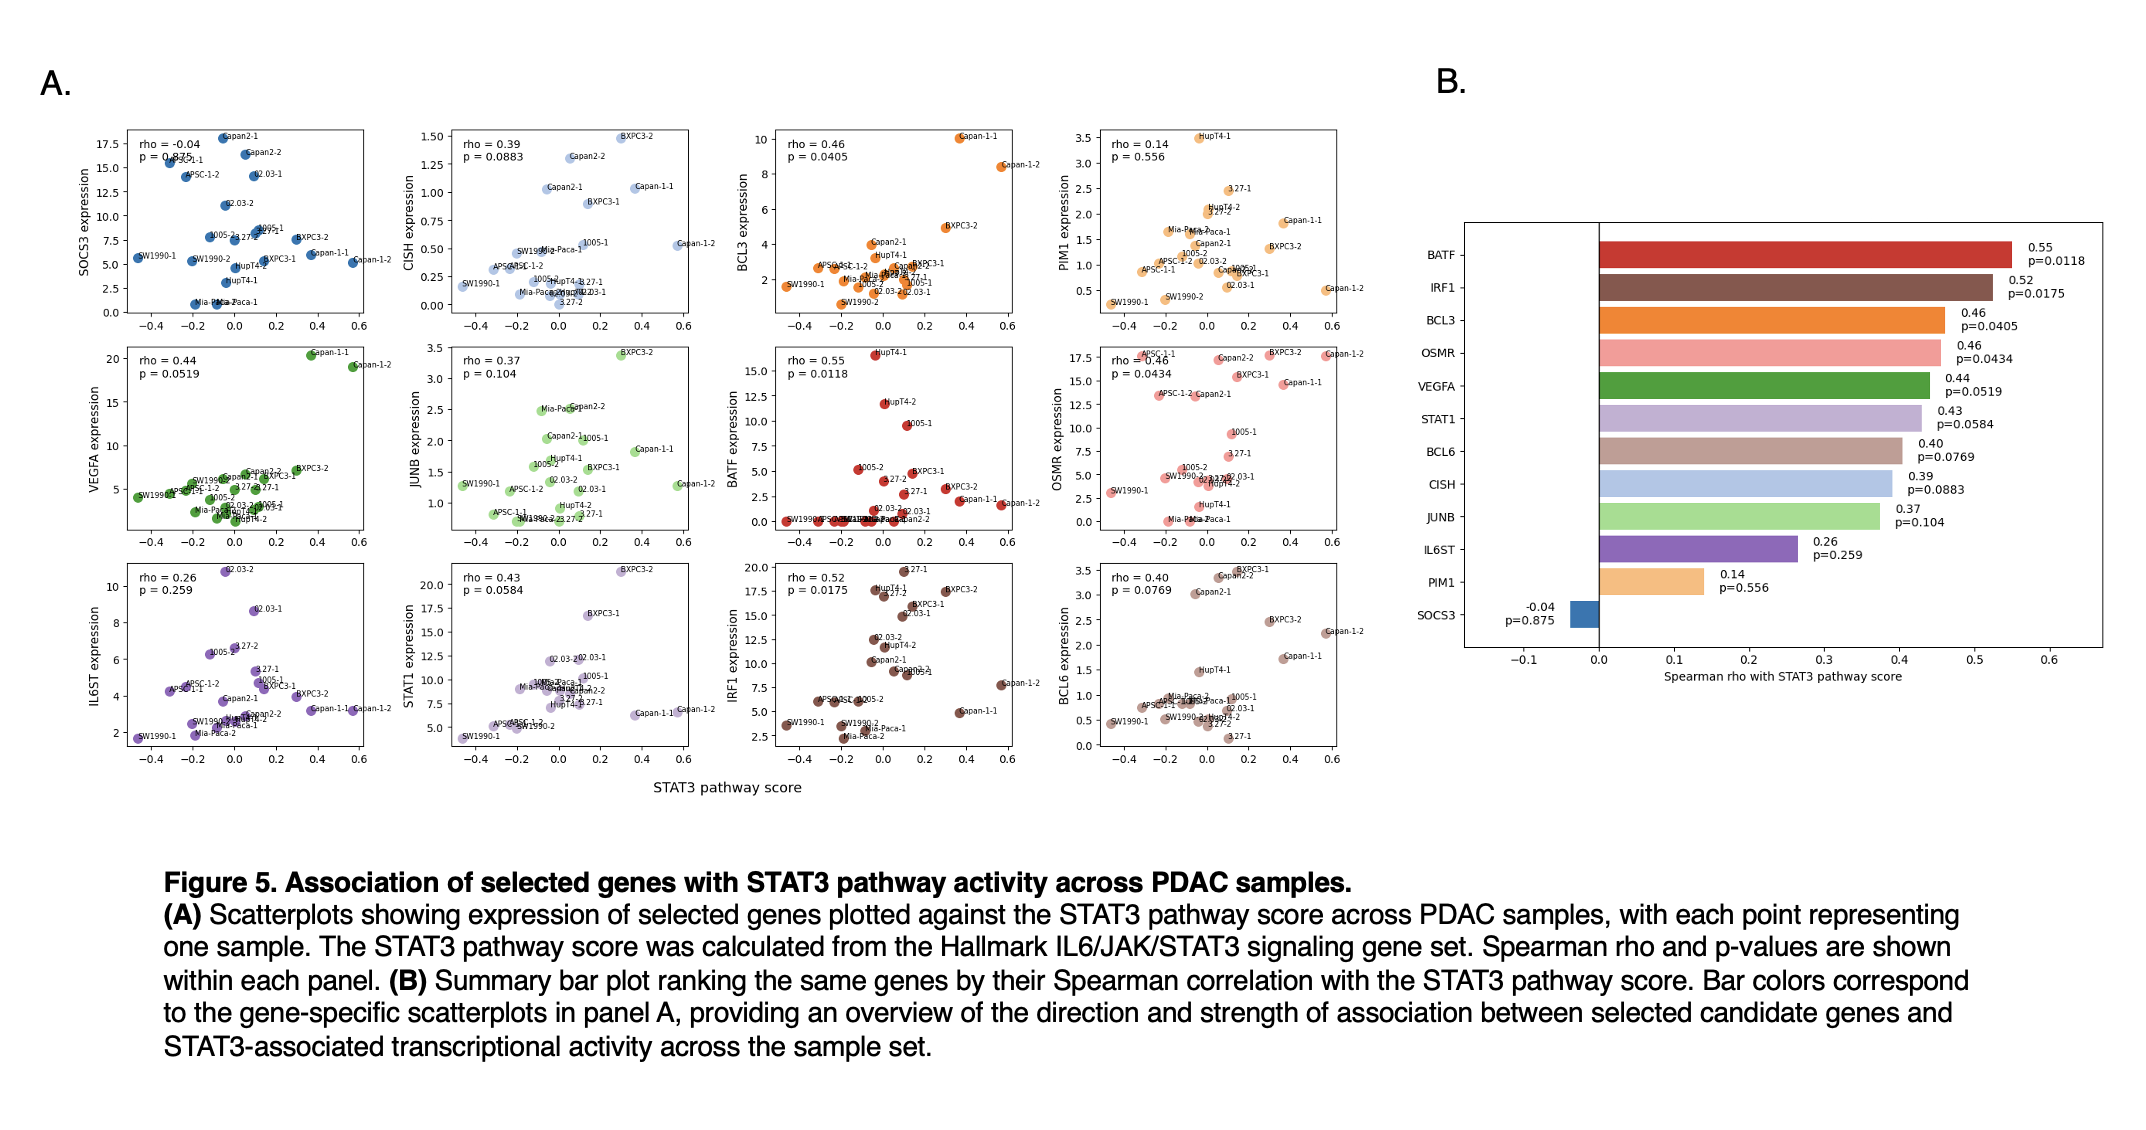
To identify genes whose expression tracked with variation in STAT3 pathway activity across the PDAC panel, we compared selected transcripts against the STAT3 pathway score and ranked them by Spearman correlation. BATF showed the strongest association (ρ = 0.55, p = 0.0118), followed by IRF1 (ρ = 0.52, p = 0.0175), BCL3 (ρ = 0.46, p = 0.0405), and OSMR (ρ = 0.46, p = 0.0434), indicating moderate positive relationships that reached statistical significance. VEGFA also showed a similar trend in magnitude (ρ = 0.44) but fell just above the conventional significance threshold (p = 0.0519), while STAT1 (ρ = 0.43, p = 0.0584), BCL6 (ρ = 0.40, p = 0.0769), CISH (ρ = 0.39, p = 0.0883), and JUNB (ρ = 0.37, p = 0.104) showed weaker evidence of association. IL6ST and PIM1 were only weakly correlated, and SOCS3 showed no meaningful relationship (ρ = -0.04, p = 0.875). Together, these results suggest that a subset of genes, particularly BATF, IRF1, BCL3, and OSMR, more closely reflects variation in STAT3-associated transcriptional activity across samples, whereas others show only modest or no evidence of coordinated behavior.
Conclusion
Together, these analyses identify candidate readouts for evaluating STAT3 degradation in MiaPaCa-2 cells. If STAT3 degradation is effective, reduced STAT3 abundance should be accompanied by reduced expression of at least some STAT3-associated genes, particularly BATF, IRF1, BCL3, and OSMR. Because these correlations were derived from only 20 samples, they should be considered hypothesis-generating. In Figure 5A, each gene is plotted with its own y-axis scale because expression ranges differed substantially across genes. This scaling makes within-gene patterns easier to see, but the panels should not be used to compare absolute expression levels between genes. Overall, this analysis provides a practical starting point for selecting markers to test after STAT3 degradation in MiaPaCa-2 cells.
References
-
National Cancer Institute. (2024). “Cancer Stat Facts: Pancreatic Cancer”
https://seer.cancer.gov/statfacts/html/pancreas.html - Lesina, Marina, et al. "Stat3/Socs3 activation by IL-6 transsignaling promotes progression of pancreatic intraepithelial neoplasia and development of pancreatic cancer." Cancer Cell 19.4 (2011): 456-469.
- Bromberg, Jacqueline, and James E. Darnell. "The role of STATs in transcriptional control and their impact on cellular function." Oncogene 19.21 (2000): 2468-2473.
- Luo, Shengnan, et al. "Long-read RNA sequencing dataset of human pancreatic cancer cell lines." Scientific Data 12.1 (2025): 1653.
-
Subramanian, A., et al. (2005). "Gene set enrichment analysis: A knowledge-based approach for interpreting genome-wide expression profiles." PNAS 102.43: 15545-15550.
https://www.gsea-msigdb.org/gsea/msigdb/human/geneset/HALLMARK_IL6_JAK_STAT3_SIGNALING.html
Code and reproducibility
List software, versions, and main scripts here.